 Often we would like to show some facts from different angles and charts can do the job perfectly.
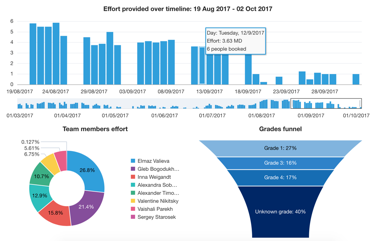
Thanks to APEX native charts, it is possible to add an overview scrollbar to the chart. It is supported for vertical bar, line, area, stock, and combination charts. The overview scrollbar displays an overview of the entire dataset, and you can interact with it with the following gestures:
- Drag the window or the window handles to scroll or zoom.
- Click on an unselected area to jump to that spot.
And why do not use this window as a filter for other data sets?
To catch and process events triggered when the viewport is changed due to a zoom or scroll operation, bind an event listener to the viewportChange event and assign the viewport min and max value to APEX items which are used in the query of a report.
Step by step recipe:
-
Add a chart to the page and enable the Overview.
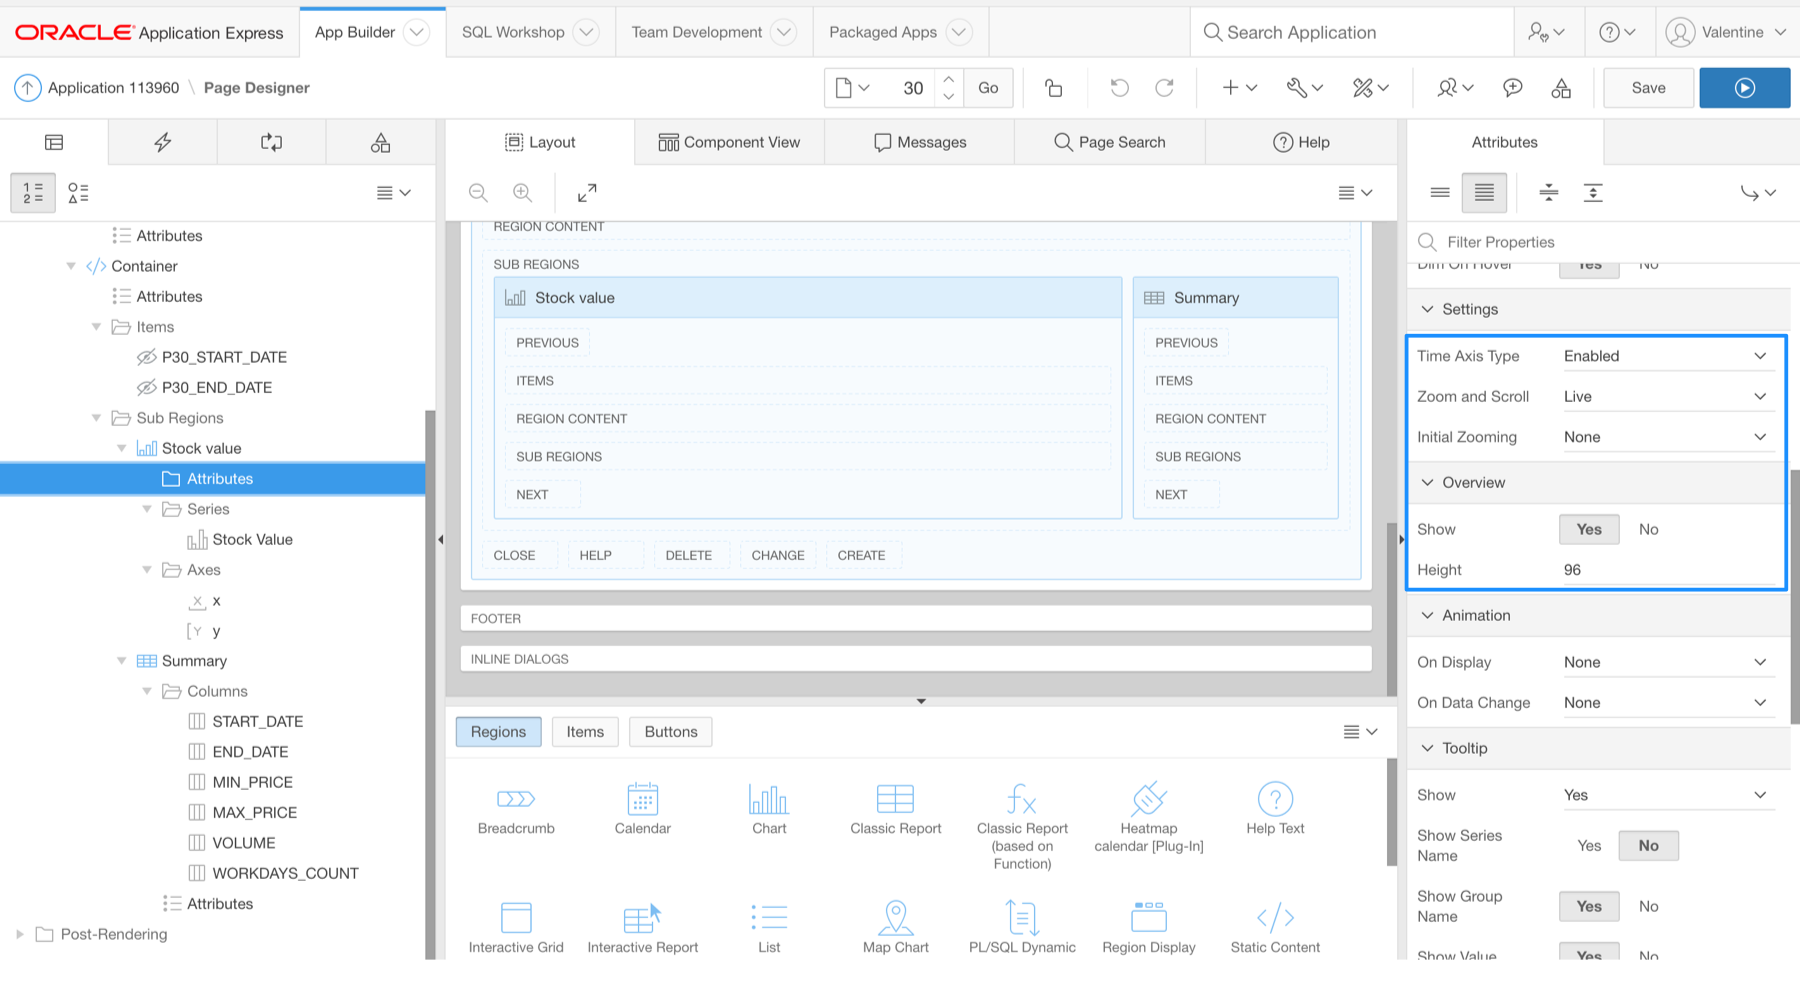 The static ID for the chart region will be
 chartSVin my example. -
Add two hidden items to the page, they are P30_START_DATE and P30_END_DATE in my example.
-
Add a classic report region with a filter in the query:
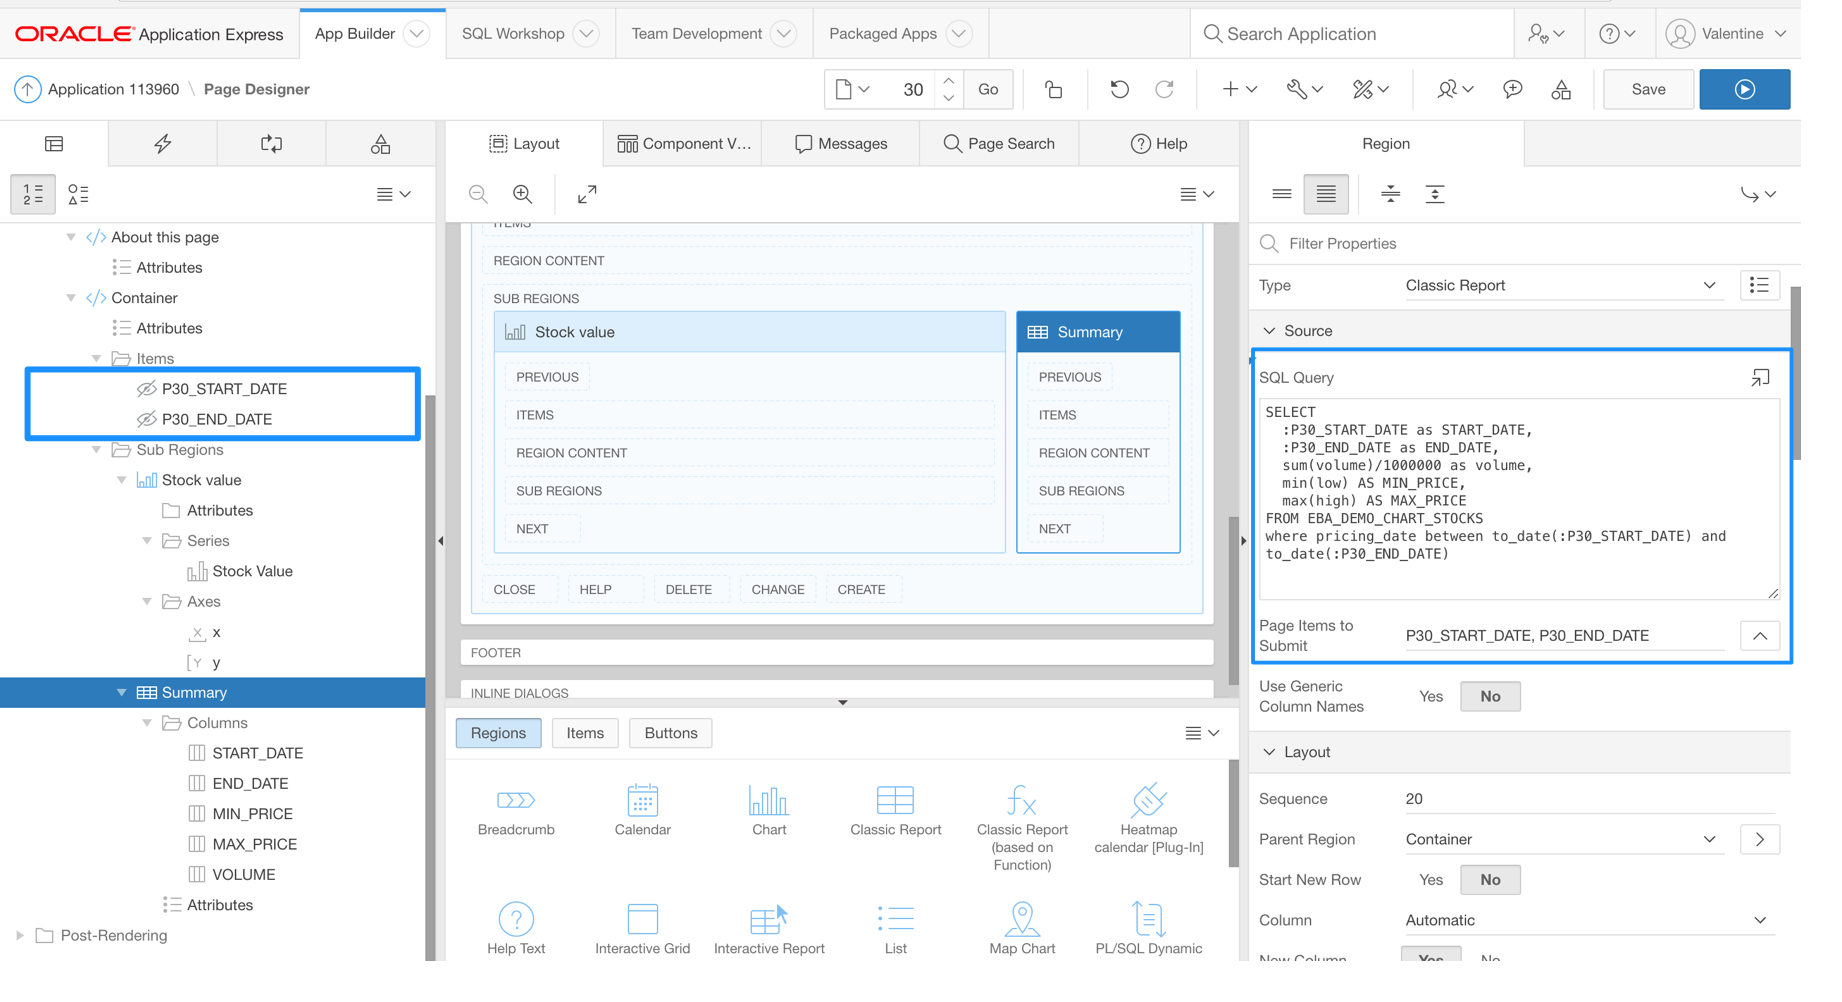 Region static ID will be
 tableSummaryin the example. Do not forget to add P30_START_DATE, P30_END_DATE to the Page Items to Submit. -
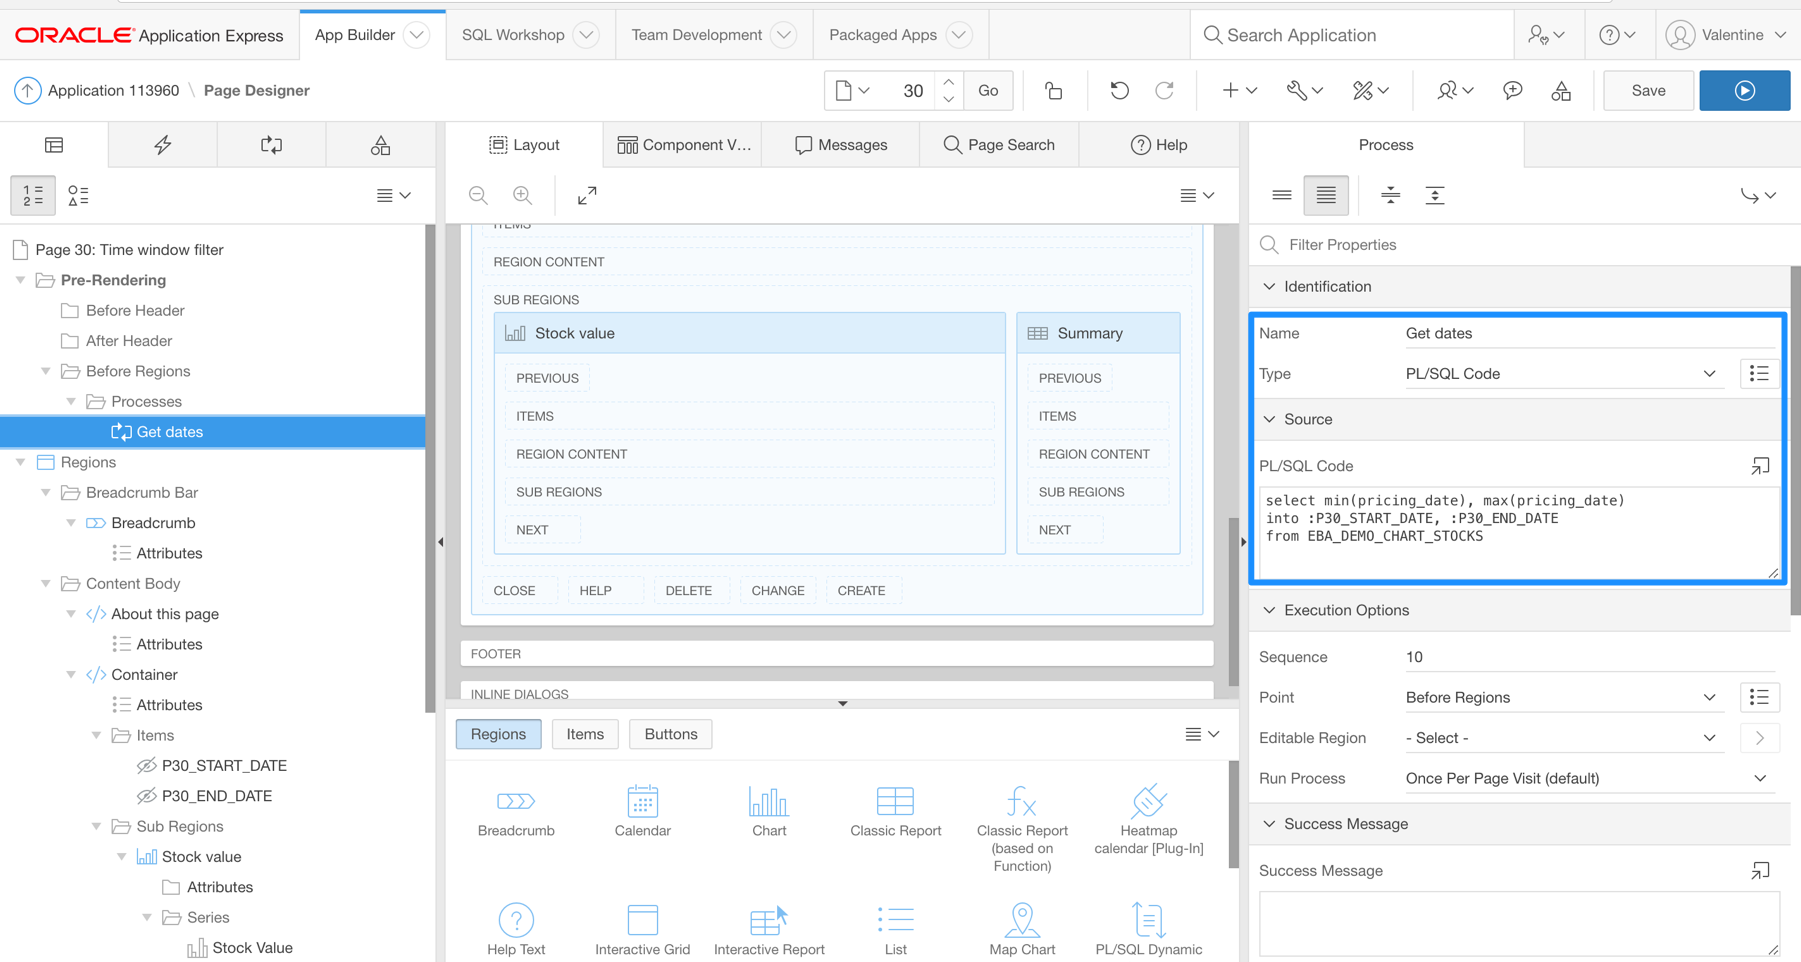
Set initial values for the filter:
-
Add the following code to to chart JavaScript Code attribute:
function( options ){
    // Setup a callback function which gets called when chart zoomed or scrolled
    options.viewportChange = function (event, data) {
            // var detail = data;
            if(data['xMin']){
              var lDate = new Date(data['xMin']);
              apex.item('P30_START_DATE').setValue(apex.jQuery.datepicker.formatDate("dd-M-yy", lDate));
            }
            if(data['xMax']){
              var lDate = new Date(data['xMax'])
              apex.item('P30_END_DATE').setValue(apex.jQuery.datepicker.formatDate("dd-M-yy", lDate));
            }
            $("#chartSV_jet").ojChart(
              {title:
                {
                  text: 'Stock value chart: ' +
                    apex.jQuery.datepicker.formatDate("dd M yy", new Date(apex.item('P30_START_DATE').getValue())) +
                    ' - ' +
                    apex.jQuery.datepicker.formatDate("dd M yy", new Date(apex.item('P30_END_DATE').getValue())),
                  halign: 'center'
                  }
                });
            apex.region('tableSummary').refresh();
        };
    return options;
}
The code defines viewportChange callback function which sets dates to the P30_START_DATE and P30_END_DATE items, updates the chart title and refreshes the report.
Here you can see the APEX demo application in action.
Caveat
There is Initial Zooming attribute available for the APEX chart region with the following options:
Firstto Initially zoom to the first data points that can fit in the chart plot area.Lastto Initially zoom to the last data points that can fit in the chart plot area.Noneto disable initial zooming.
Unfortunately we cannot relay on First or Last option because to ojChart does not set xAxis.viewportMax and xAxis.viewportMax attributes and even if the chart zoomed and scrolled we do not know the boundaries.
So, the following code returns null just after page load:
$("#chartSV_jet").ojChart("option", "xAxis.viewportMax")
But after first user interaction with the chart zoom or scroll features, the following code will get the viewport min and max dates:
var lMinDate = new Date($("#chartSV_jet").ojChart("option", "xAxis.viewportMax"));
apex.item('P30_START_DATE').setValue(apex.jQuery.datepicker.formatDate("dd-M-yy", lMinDate));
var lMaxDate = new Date($("#chartSV_jet").ojChart("option", "xAxis.viewportMin"));
apex.item('P30_END_DATE').setValue(apex.jQuery.datepicker.formatDate("dd-M-yy", lMaxDate));
It is possible to set the viewport manually:
var lMin = new Date('01-JAN-2016');
$("#chartSV_jet").ojChart("option", "xAxis.viewportMin", lMin.valueOf());
var lMax = new Date('31-DEC-2016');
$("#chartSV_jet").ojChart("option", "xAxis.viewportMax", lMax.valueOf());
Knowing this, you can create your own implementation of initial zooming!
Additional reading:
Overview article about JET Charts in Application Express 5.1
Class ojChart within the Oracle JET documentation
Oracle JET cookbook, Zoom & Scroll: Time Axis example